The work described here arose out of an experimental collaboration between Cranfield University and the University of Leeds in the 1990’s, and funded by the EPSRC. A number of articles and conference papers have been published from this work, which are identified in the text below. Particular acknowledgement must be made of Dr Robert Woolley (currently at the University of Sheffield), who conducted the Shadowgraph video experiments that are reported below.
Two types of explosion flame instabilities and their interaction are discussed here: hydrodynamic and thermo-diffusive instabilities. These types of instabilities are obtained and investigated in an optically accessible combustion vessel, called a combustion bomb. This discussion will briefly review the nature of the instabilities before showing some of the results.
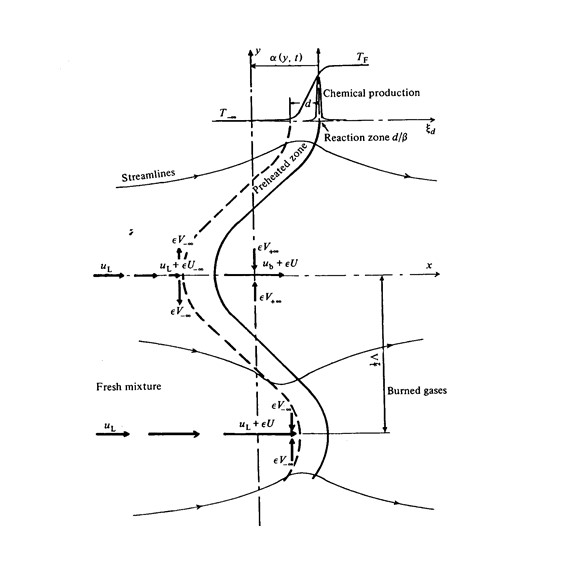
The hydrodynamic instability (otherwise known as Darrius-Landau instability) arises in a flame with a positive local curvature. As the curved flame surface propagates towards the unburned mixture, the leading edge of the curved flame surface encounters the unburned mixture before the recessed flame surface. Heat release at the leading edge flame surface is conducted and radiated towards the unburned mixture, thereby lowering the local unburned mixture density and deflecting the mixture immediately to the sides of the leading edge (apex) of the flame towards the recessed flame surface. This increases the density of the mixture in the neighbourhood of the recessed surface. The flame responds to the local changes in density by increasing its velocity at the apex, and lowering the velocity in the recessed region, thereby increasing the amplitude of the surface instability. Figure 1 shows the effect on a sinusoidally curved flame surface.
The thermo-diffusive instability is able to develop and grow on a flame surface when the Lewis number for the deficient reactant entering the flame is below a critical value. When this occurs, the relatively large diffusivity of the deficient reactant produces a mixture gradient along the flame surface, with the convex surface receiving more deficient reactant, and the concave surface receiving less deficient reactant. This causes the convex surface to accelerate, and the concave surface to recede, thereby growing the surface instability.
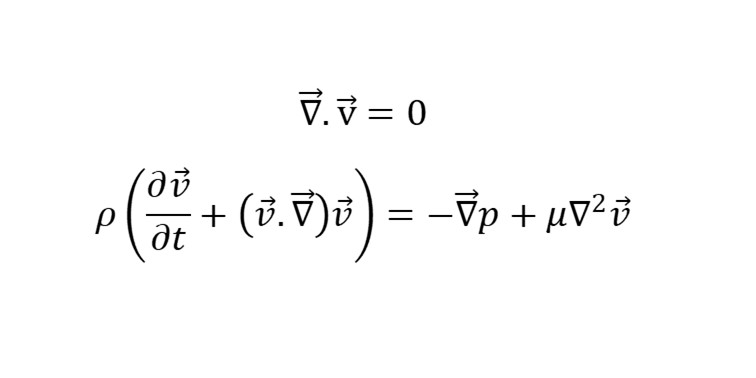
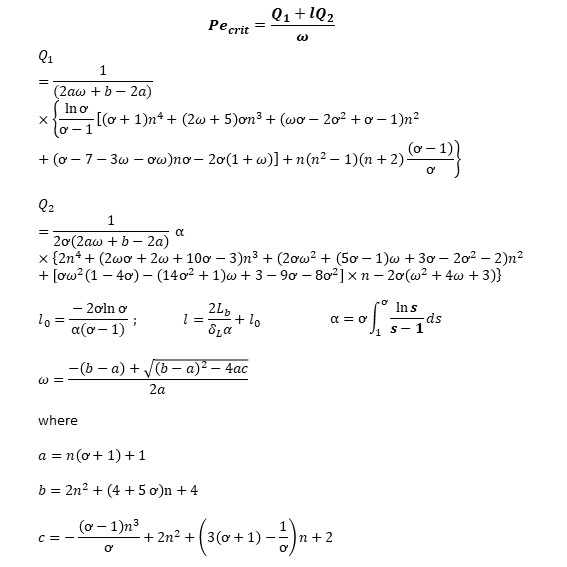
The following theoretical presentation is based on the work of Bechtold and Matalon (https://doi.org/10.1016/0010-2180(87)90015-0), who conducted a linear stability analysis on spherical explosion flames. Equation 1 below identifies the governing equations for gases ahead of, and behind the flame front, which is considered to be thin relative to the radius of the expanding explosion flame.
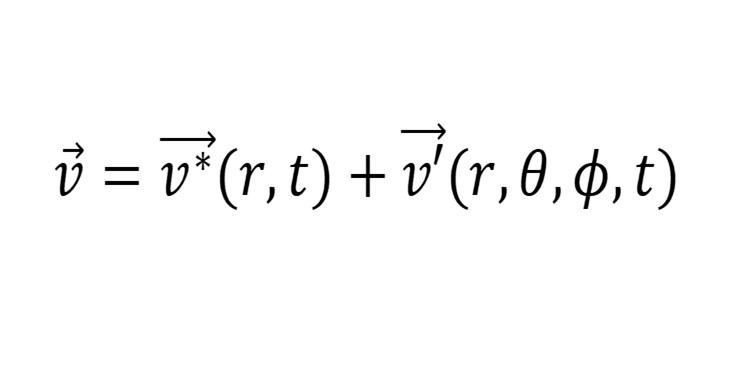
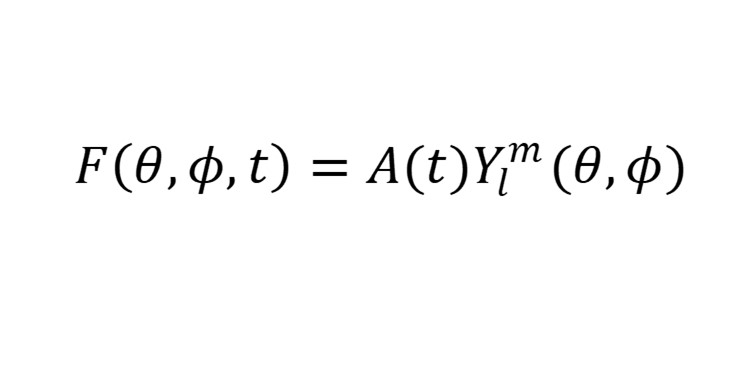
The flame surface is assumed to have a sinusoidally varying surface profile defined by the spherical harmonics. The flow velocity of the unburned mixture into the flame surface is decomposed into a radial component and an angle dependent component.
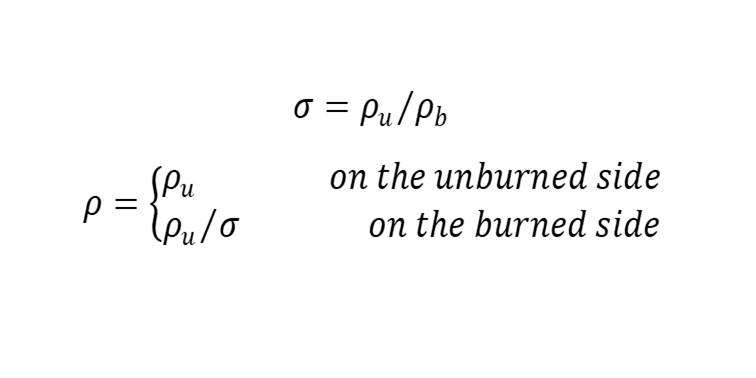
The densities of the unburned and burned gases are defined by
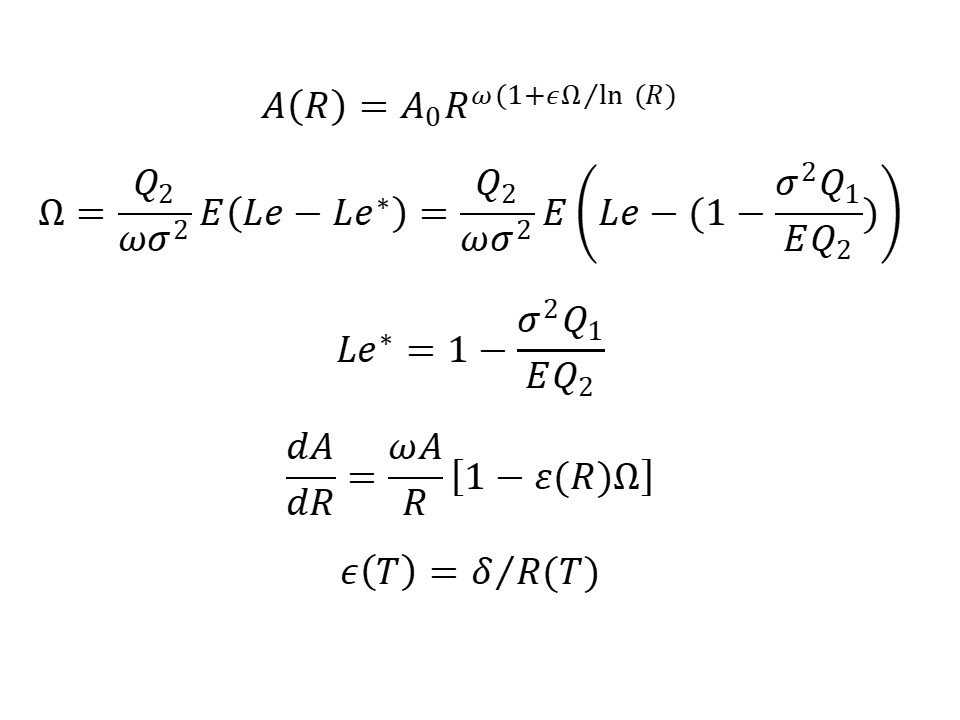
The amplitude of an instability on the surface of the flame will grow or decay depending on the local properties of the flame in conjunction with the flame stretch. This can be expressed in terms of the growth or decay of the oscillations on the flame surface as
This modifies the equations for the flow velocity, and enables the derivation of the dispersion relation for the growth or decay of the flame surface instability. An expression for A(t) is derived, which is converted to radius dependent A(R) by eliminating the time variable. R is the normalised radius of the flame at time t.
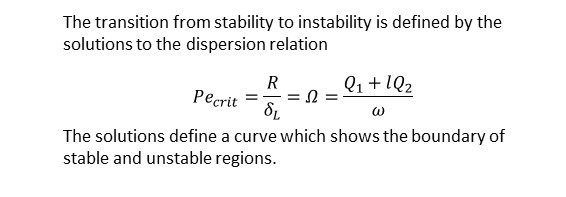
The critical condition for the growth of an instability as a function of flame radius is Pecritical > Ω.
The work described below has been published in various journal and conference papers. These are available for inspection and download at (2) (PDF) Instabilities in high pressure, iso-octane-air spherical explosion flames (researchgate.net), (2) (PDF) Instabilities in High Pressure, Iso-octane-air Spherical Explosion Flames (researchgate.net), https://www.researchgate.net/publication/235764159_A_Length_Scale_Analysis_of_Instabilities_in_High_Pressure_Explosion_Flame, (2) (PDF) Instabilities and soot formation in high pressure, rich, iso-octane-air explosion flames (researchgate.net), https://doi.org/10.1016/S0010-2180(00)00113-9.
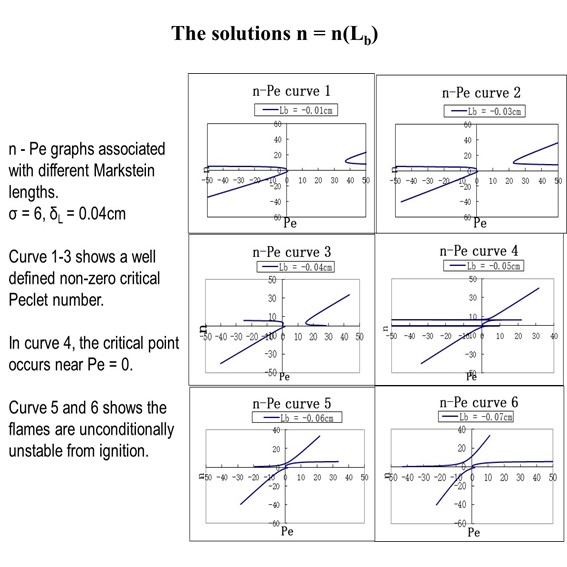
The graphs shown in Figure 3 reveal that cases 1 to 3 exhibit a regime of stability until a critical Peclet number is achieved during the expansion of the flame. The stability that is achieved for small Peclet numbers is a result of the stabilizing effect of flame stretch rate. However, once the flame stretch rate falls below a critical value, the flame becomes unstable. Curves 4 to 6 are examples of explosion flames which are unconditionally unstable following ignition.
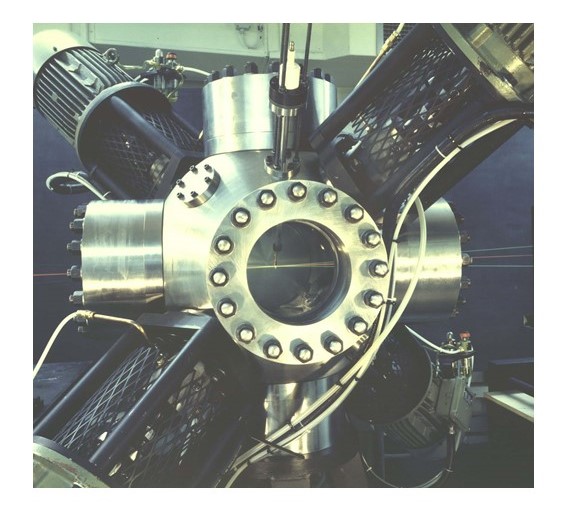
The experimental work described below was conducted in the Leeds bomb, which is shown in Figure 4 below, and which is based in the Department of Mechanical Engineering, University of Leeds.
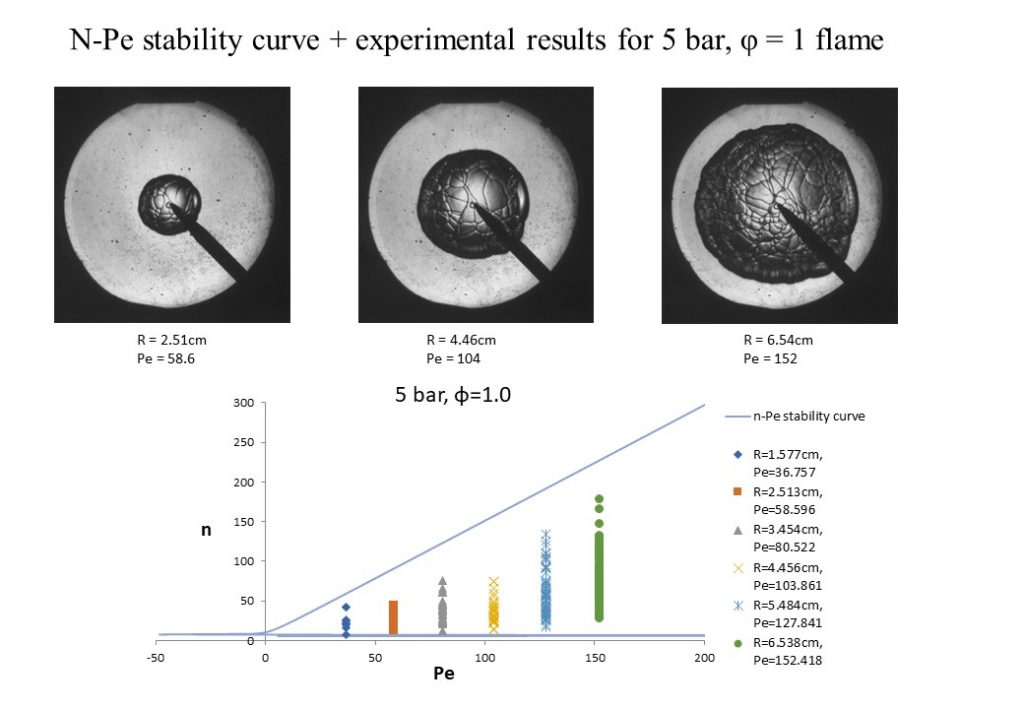
Lets us first consider the case of a high-pressure stoichiometric iso-octane-air explosion flame. In this case, thermo-diffusive effects should be absent, and so any instability observed is due to the hydrodynamic instability.
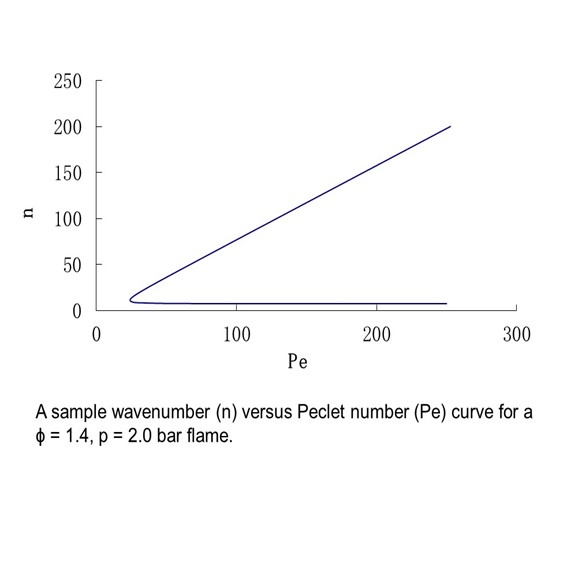
Now we turn to rich mixtures of iso-octane in high pressure air in order to provide a more robust test of the linear model. The first example is for a φ = 1.4, p=2.0 bar iso-octane-air explosion flame.
In this case, the linear model appears to be poor at predicting the critical Peclet number for inception of instability, and the wavenumber range for instability as the flame grows. Now, lets turn to the manner in which the cellular wavelengths and wavenumber vary with equivalence ratio. Figure 11 shows the dispersion relation graphs for 2 bar explosion flames for equivalence ratios φ = 1.4, 1.6 and 1.8.
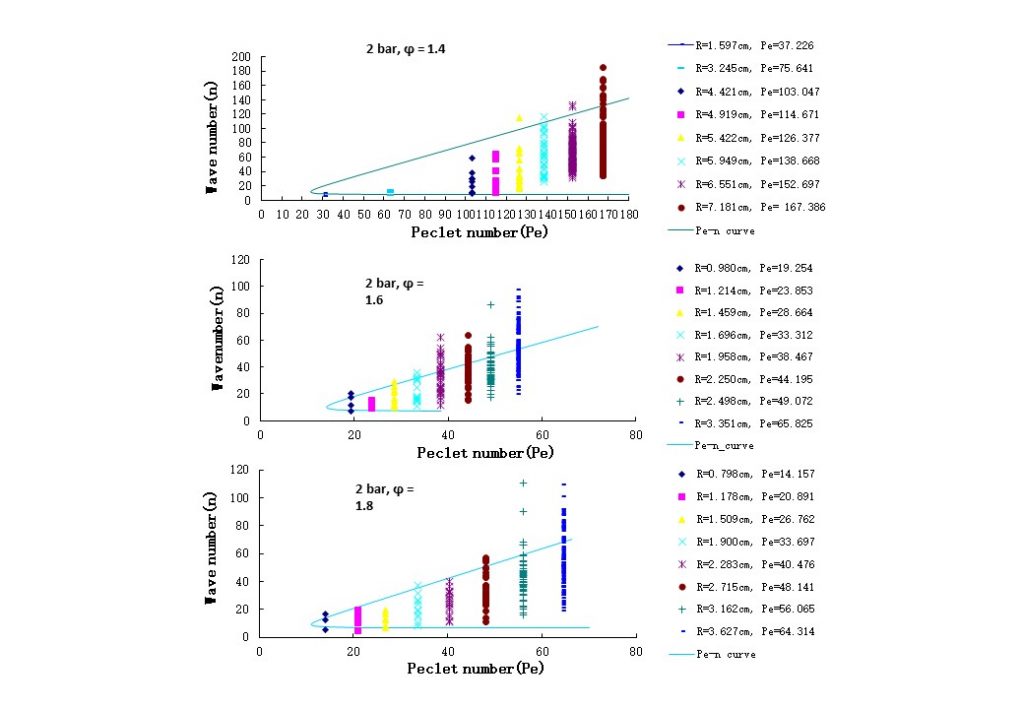
An analysis of Figure 11 reveals that the linear model is very good at predicting the onset to instability for these flames. However, the model is not as successful at predicting the range of wavenumbers that are capable of being excited by the hydrodynamic/thermo-diffusive instability. As the flame expands, it appears that non-linear effects that are not captured by the linear model are responsible for the larger range of wavenumbers that are excited at larger Peclet numbers.
Now we move to rich explosion flames obtained at higher pressures. We will focus on φ = 1.4 explosion flames at 4.0 and 5.0bar respectively. Figure 12 contains a video which shows a shadowgraph video of the 4.0bar explosion flame.
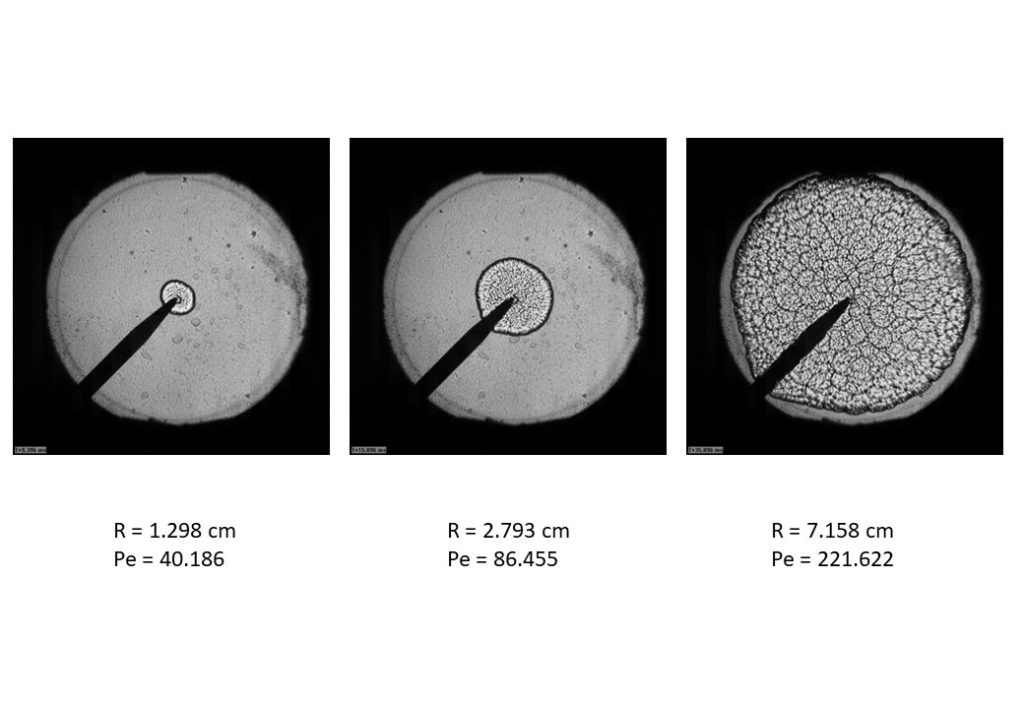
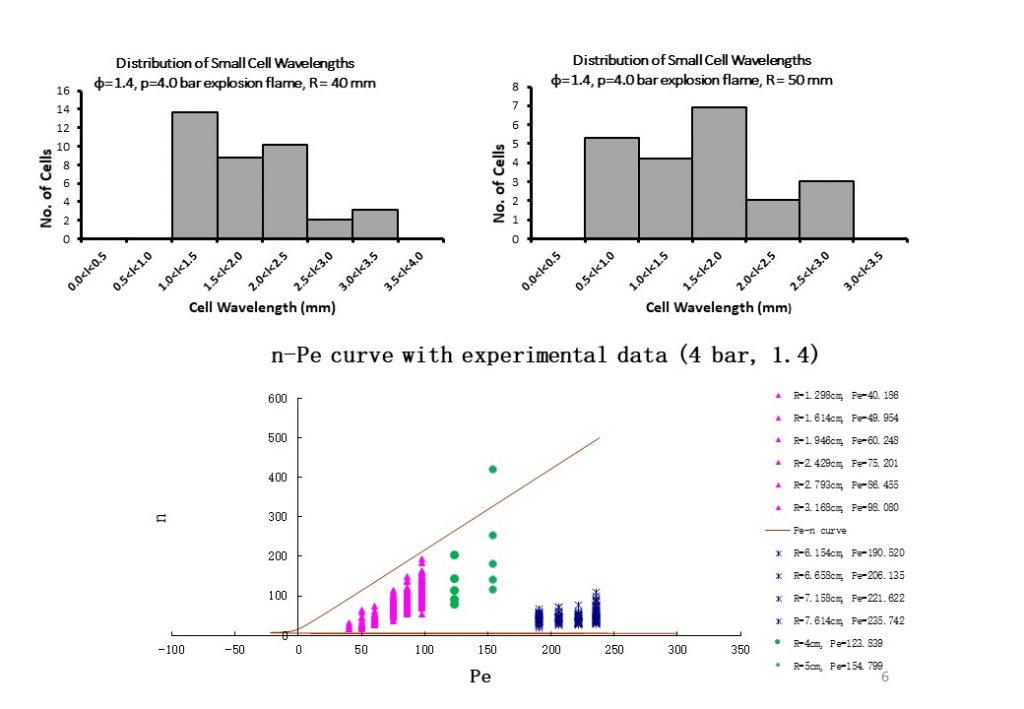
An analysis of the dispersion solution graph shown in Figure 14 shows that this flame is unconditionally unstable from ignition. A further analysis of the video in Figure 12, and the images and graphs in Figures 13 (Pe = 221.6 graph) and 14 reveals an interesting and important new feature in these flames. It is apparent that two types of cellularity form on the flame surface. The first type of cellularity is initiated at small radius (Peclet no.) and is of small wavelength (large wavenumber excitation). This is seen in the purple and green cells in Figure 14. However, at a Peclet number Pe ~ 180, a second large wavelength cellularity develops on the flame surface (blue data points). For flames with Pe > 180, the small wavelength cells are imbedded within the larger wavelength cells.
Now we turn our attention to a similar explosion flame, but obtained at 5.0bar pressure. Figure 15 below includes a video of a φ = 1.4, p=5.0 bar explosion flame.
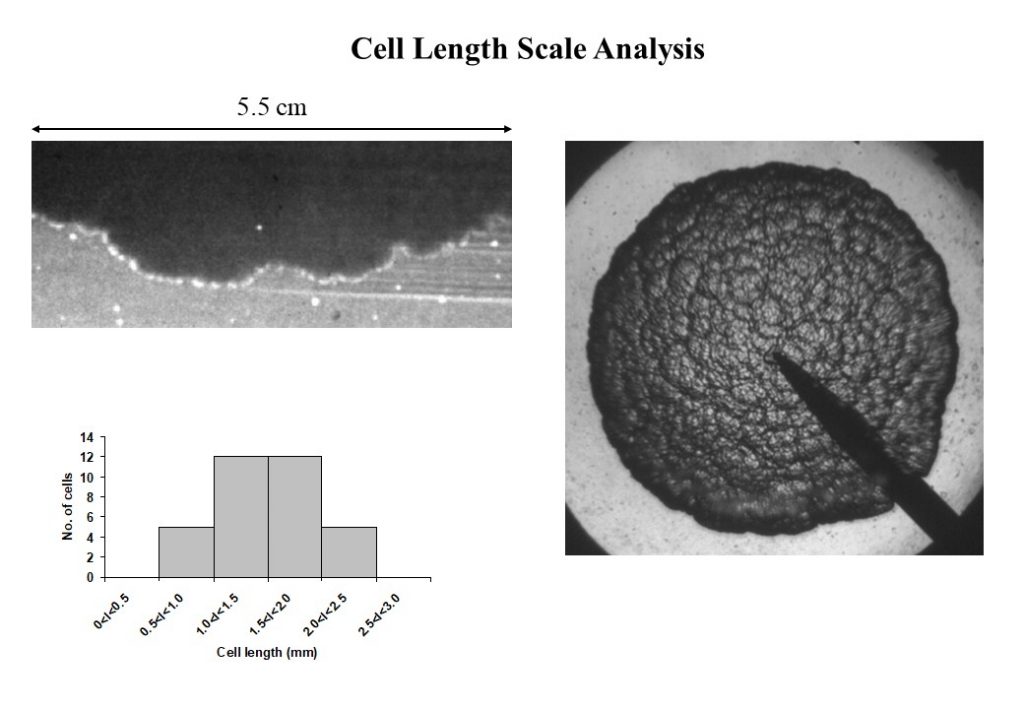
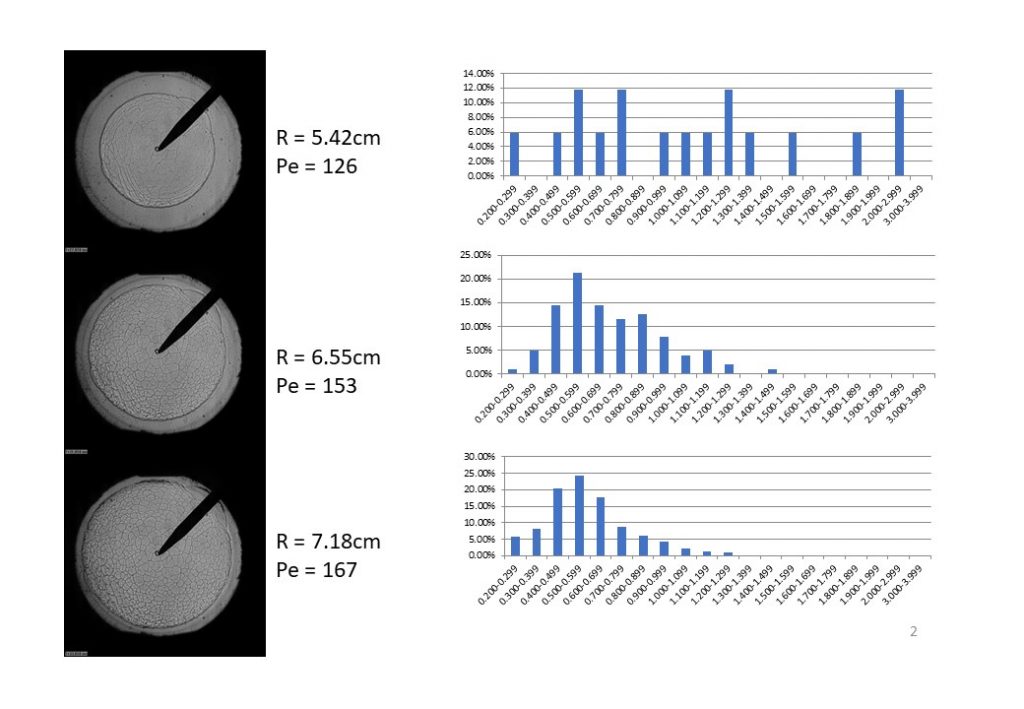
The video in Figure 15 shows the development of a small-scale textured flame surface, imbedded within larger wavelength cells that have formed on the explosion flame surface. Figure 16 shows two images taken from a φ = 1.4, p = 5.0bar explosion flame. The top right hand image shows off the finely textured surface that is imbedded in larger wavelength cells on the flame surface. The fine texture consists of small wavelength cells on the flame surface. This can be seen from the top left image, which was obtained using OH planar laser induced fluorescence. This image reveals both the small wavelength cellularity that is imbedded in larger wavelength cells forming the explosion flame surface. Contrast this with the images of the flame surface shown in Figure 6, where the flame surface obtained inside large wavelength cells was smooth and continuous. The histogram in Figure 16 shows the range of small wavelength cells present in the flame, ranging from 0.5mm to 2.5mm in length.
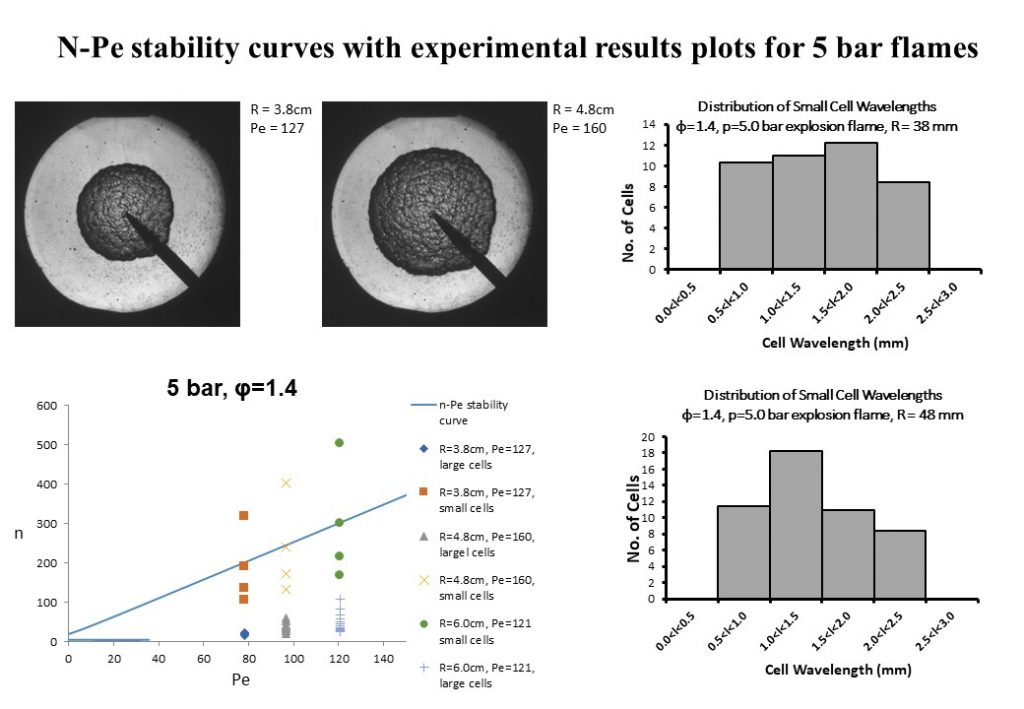
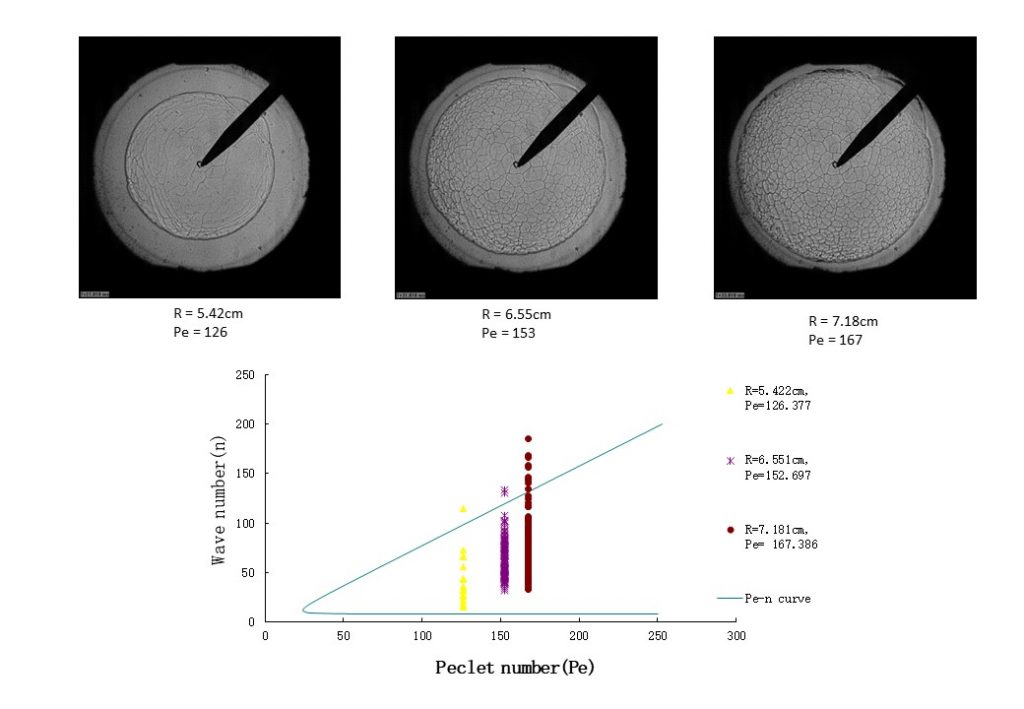
Figure 17 shows the graph of the dispersion relation wavenumber solution as a function of Peclet number, defining the range of unstable wavenumbers that are able to be excited by the hydrodynamic/thermo-diffusive instability. The solution profile shows that this explosion flame is unconditionally unstable from ignition. As with the 4.0 bar data, cellularity with two distinct ranges of wavelengths form on the explosion flame surface. These are a small wavelength cellularity (0.5 – 2.5mm wavelength) imbedded in large wavelength cells (4 – 15mm wavelength). Furthermore, the combined instability is able to excite significantly larger wavenumber cells than that predicted by the linear model.