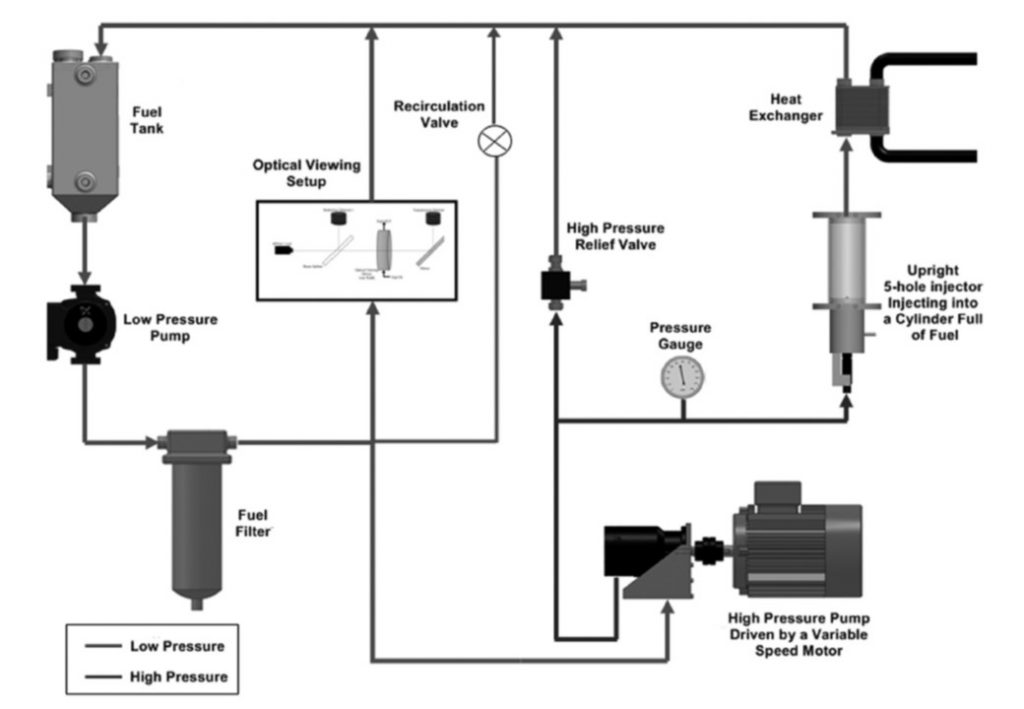
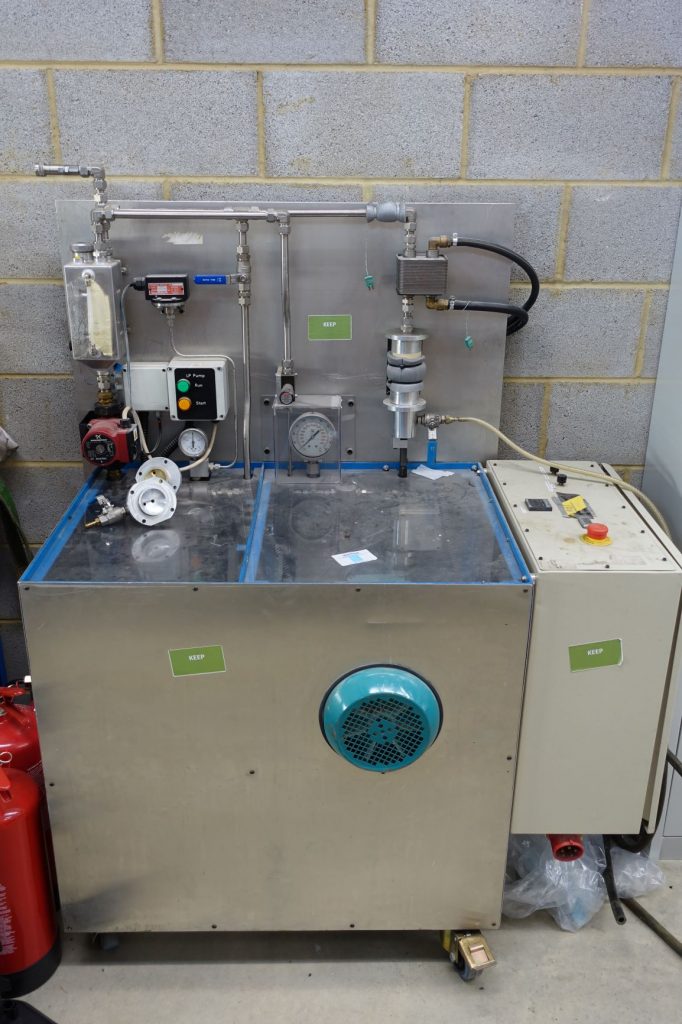
Ultrasound induced cavitation in Diesel fuel has been shown to alter the chemical composition of the fuel sample, leading to soot-like particulate formation (https://doi.org/10.1016/j.fuel.2015.04.026). Following this, an investigation into the chemical effects of high pressure hydrodynamic cavitation on Diesel fuel samples was launched. A recirculating 630bar high pressure flow rig was designed, manufactured and employed to compress and circulate Diesel fuel samples through a commercial Diesel injector with the needle removed, into a receiver, and back around the circulator, using a Dynex 1318H-10 pump (Figures 1 and 2).
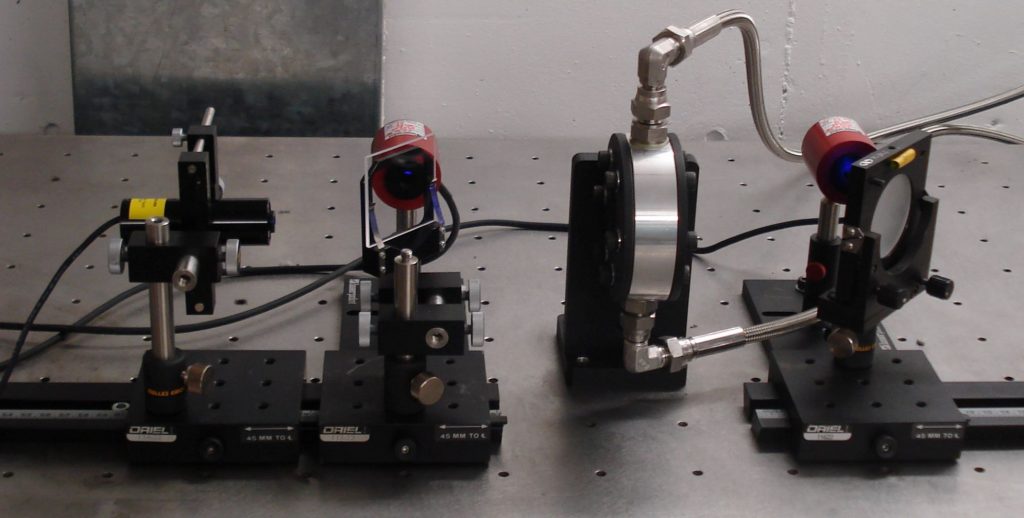
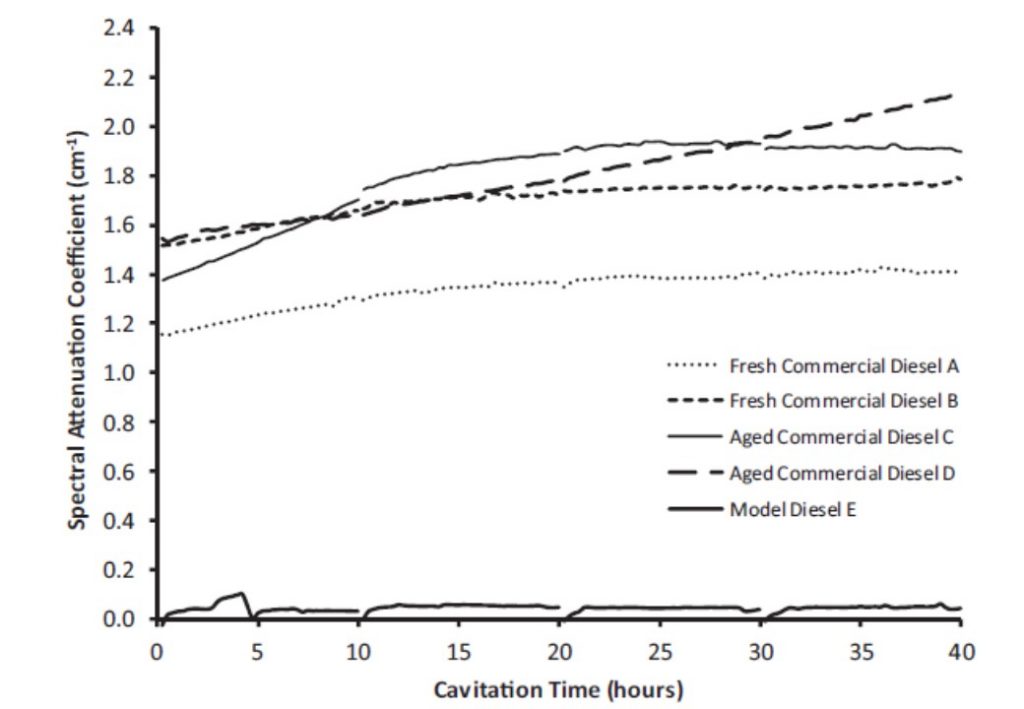
Alterations in the composition of the Diesel fuel samples were to be identified by a variation in the optical extinction coefficient of the cavitated Diesel fuel samples with recirculation flow time. Consequently, a spectral extinction measurement system was developed and deployed using a diode laser at 405nm (Figure 4). The measurements showed a consistent increase in the 405nm spectral extinction coefficient with time for a number of commercial Diesel fuel samples. In contrast, a paraffinic rich model Diesel fuel sample showed very little variation with time (Figure 5).
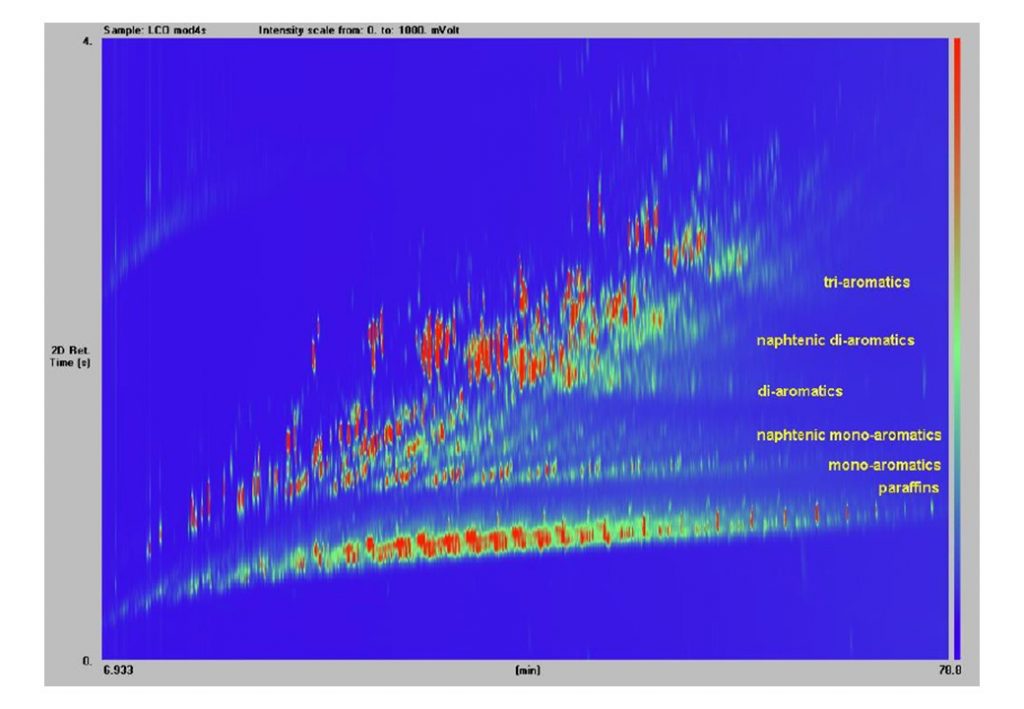
Six fresh and four aged commercial Diesel fuel samples were subjected to 40 hours of cavitation flow through the 630bar recirculating flow rig. Sub-samples were taken from the main fuel samples before and after the 40-hour cavitation tests, and sent away for two column gas chromatography analysis (GCxGC). GCxGC analysis enables the quantitative determination of all molecular species comprising the Diesel fuel (Figure 6).
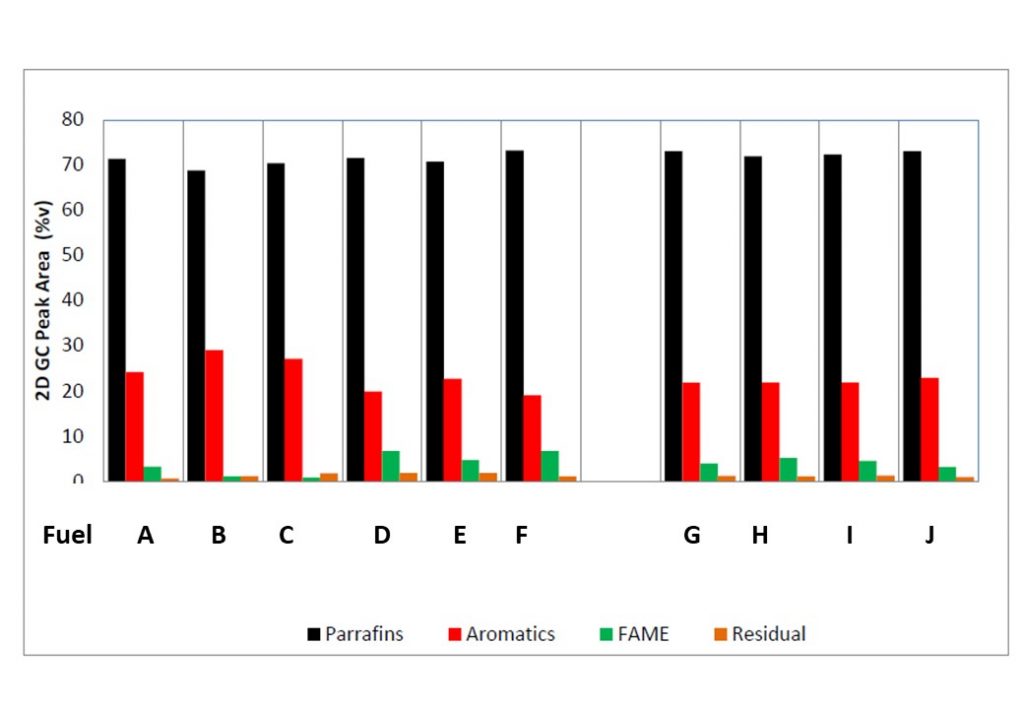
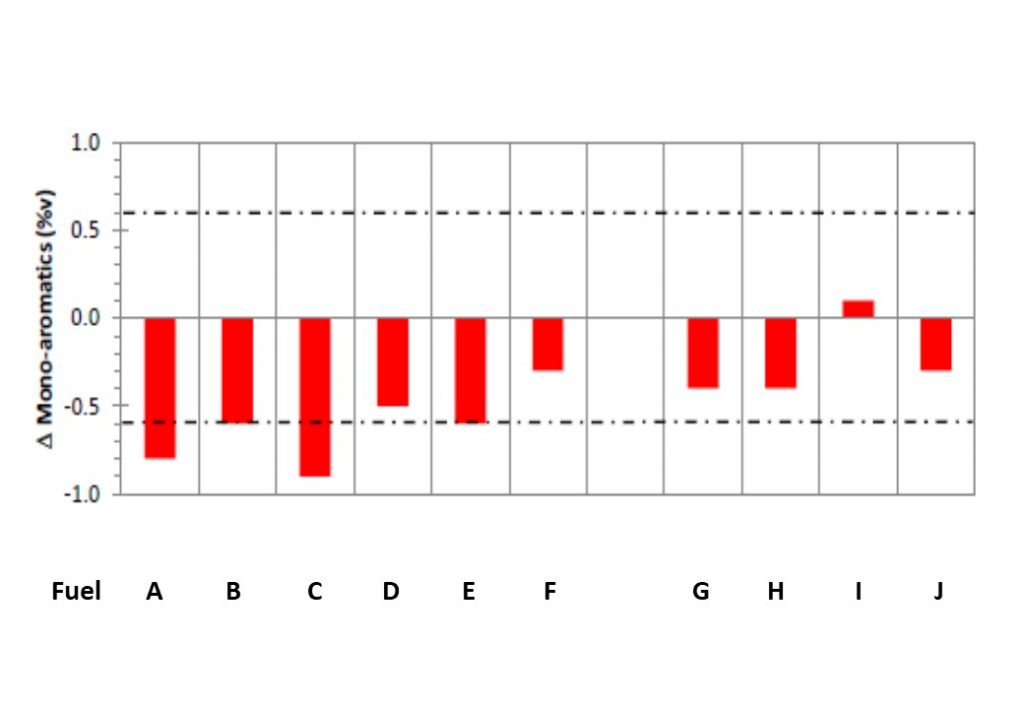
It was initially thought that the increase in spectral extinction coefficient observed in Figure 5 was caused by an increase in particulates in the Diesel fuel samples. However, later tests have revealed that the increase in the spectral extinction coefficient was caused by the formation of 4-ring and 5-ring polycyclic aromatic hydrocarbons (PAHs). Figure 7 shows the pre-cavitation composition of the 10 commercial Diesel samples subjected to cavitation tests, obtained from the GCxGC analysis. Figure 8 shows the %variation in the mono-aromatic composition in the 10 commercial Diesel fuel samples tested. It shows a consistent decrease in the fraction of mono-aromatics comprising the Diesel fuel samples. This, together with the growth in 4- and 5-ring PAHs, suggests that the mono-aromatics and di-aromatics react to form more complex PAH molecules, eventually leading to the formation of primary soot-like nano-particles.
Recent papers on this work are available from https://doi.org/10.1177/1468087413497005, and (PDF) An experimental investigation into the effect of hydrodynamic cavitation on diesel (researchgate.net), and (PDF) The Effect of Cavitation on Diesel in Diesel Fuel Injection Equipment (researchgate.net).